
July 28, 2000
Like Corn, Soybean and Wheat Sales Driven by Domestic Demand, Not Exports
Two weeks ago we saw that, in the case of the corn market, during the last 15 years or so domestic demand has been the real performer while corn exports barely held steady. As a result, corn exports, which averaged 28 percent of U.S. total corn demand for the ten years before the 1985 farm bill, averaged only 19 percent of total U.S. corn demand during the last four crop years.
That’s corn, but, what about soybeans and wheat?
Soybeans show a pattern similar to corn while the wheat domestic/export demand story could be a candidate for “Believe it or Not.” The full stories behind the global markets for soybeans and wheat are extremely interesting and include more than a sprinkling of international intrigue. This week, we will limit our focus to the trends of the crops’ domestic versus export demands, leaving the “Rest of the Story” to another time.
Figure 1 graphs domestic and export demand for soybeans over the 1976 to 1999 period along with averages for the ten-year periods before and after the beginning of the 1985 Farm Bill and the first four years of the current bill. Soybean domestic demand increased significantly between 1976 and 1999, and at a considerably faster rate than soybean export demand. Soybean domestic demand averaged 600 million bushels greater in the last four years, 1996-1999, compared to the earliest period, 1976-85, while export averages between the two periods increased by 100 million bushels.
In the earliest period, exports accounted for 40 percent of total U.S. soybean demand while in the last period, covering the last four crop years, exports made up 33 percent of total soybean use.
If soybean meal equivalent of soybean exports were included in the calculations, the export curve and averages would be scaled upward and the domestic curve and averages would be scaled downward but, since domestic soybean meal-use has increased faster than exports over the analysis period, the same general pattern would remain.
Just as in the case of corn, adjustments to account for livestock exports have not been made but doing so would not change the overall comparison of domestic versus export demand growth.
Figure 2 charts the numbers for wheat domestic and export demand. I know these charts contain a lot of information and require a little diligence, but, hey, this stuff is important!!
As the graph shows, wheat export volume dominated domestic demand use in the 70s and early 80s. But, in the mid-80s, domestic demand overtook exports. Since then, domestic demand has continued on a long-term upward path while exports have trended downward. Amazingly, exports, which exceeded domestic demand by 400 million bushels, on average, during the earliest period, averaged 300 million bushels below domestic demand by the last period.
In terms of share of total wheat use, exports averaged 59 percent of all demand during the period covering the last half of the 70s and first half of the 80s. For the first four years of the current farm bill, wheat exports have accounted for 33 percent of total U.S. wheat demand. Between these two periods, wheat exports went from nearly two-thirds of total wheat use to one-third of wheat use.
Demand data for soybeans and wheat this week, and for corn last week, convincingly show that since the mid-80s it is domestic demand that has been the dominant source of demand growth for major grains and soybeans—not exports. For many, these export/domestic demand patterns for major crops are unknown and for nearly everyone these patterns and trends are unexpected and definitely unwanted. Unwanted because it was thought, compared to the domestic market, it was the export market that had the most potential for growth, especially in wake of past and prospective trade agreements.
Does what we have experienced in the last 15 years necessarily mean that exports could not take off like they did in the 1970s? No, it does not. And, of course, a series of weather or other disturbances could provide relatively short-lived surges in export demand at anytime. More generally, there is no doubt that there are combinations of situations which could lead us to an extended period—say five to ten years —of export-led prosperity in grain agriculture. Freer and more open world markets could be a part of some of those combinations
However, a review of the events leading to previous grain export explosions, one in the 70s and one each during the World Wars, suggest that those combinations of events are very complex and very rare. But that’s part of the “Rest of the Story.”
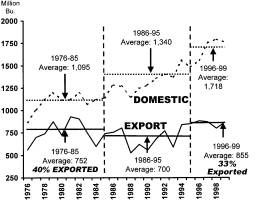
Figure 1 U.S. Domestic and Export Demand for Soybeans
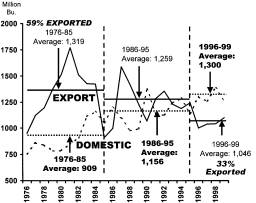
Figure 2 U.S. Domestic And Export Demand for Wheat
Daryll E. Ray holds the Blasingame Chair of Excellence in Agricultural Policy, Institute of Agriculture, University of Tennessee, and is the Director of the UT’s Agricultural Policy Analysis Center. (865) 974-7407; Fax: (865) 974-7298; E-mail: dray@utk.edu: Web Address http://agpolicy.org.
Reproduction Permission Granted with
1) Full attribution to Daryll E. Ray and the Agricultural Policy Analysis Center, University of Tennessee, Knoxville, TN;
2) An email sent to hdschaffer@utk.edu indicating how often you intend on running Dr. Ray’s column and your total circulation. Also, please send one copy of the first issue with Dr. Ray’s column in it to Harwood Schaffer, Agricultural Policy Analysis Center, 310 Morgan Hall, Knoxville, TN 37996-001.