
Comparing 1980 and 2009, world corn production roughly doubled while exports are nearly the same
As a part of our series on agricultural exports, we want to revisit some familiar ground by taking a fresh look at the data and clarifying some of the issues.
When governmental officials or farm leaders get excited about an increase in exports, it is important to look at the measure they are using. In each instance, are they referring to the value of exports or the volume of exports? It makes a difference.
Let’s look at corn. Since 1980, world corn exports have remained essentially flat with 3.2 billion bushels traded in 1980 and 3.3 billion bushels traded in the 2009 crop year. During this same period, the production of corn in the world has nearly doubled growing from 16.1 billion bushels to 31.4 billion bushels today.
As a result, the share of corn production that is exported has dropped from 19.6 percent in 1980 to 10.6 percent in 2009 (Fig. 1).
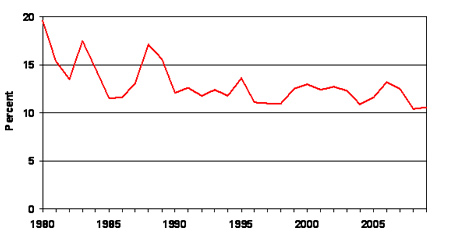
Figure 1. World corn exports as a percent of world corn production, 1980-2009. Data source: USDA.
Turning to the US, corn exports reached 2.39 billion bushels in 1980 (Fig. 2). From that point corn exports fell before reaching 2.37 billion bushels in 1989. Another peak, 2.23 billion bushels was reached in the 1995 crop year. The most recent peak in 2007 reached 2.44 billion bushels, 50 million bushels above the level reached 27 years earlier.
Looking at the red solid line in the graph, it becomes abundantly apparent that, like with the world, US corn exports have been in a flat pattern for the last 29 years. Over that same period, the value of exports (blue dashed line) has varied from a farmgate value low price of $2.09 billion in 1986 to a projected $7.7 billion in the 2009 crop year. In making this calculation we used the season average price received by farmers because any value added beyond the farmgate does not accrue to farmers.
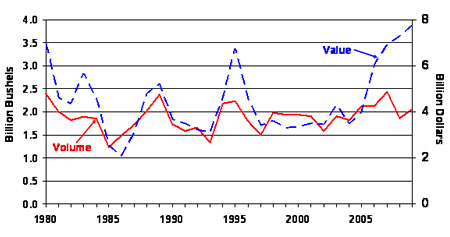
Figure 2. US corn exports – volume and value, 1908-2009. The value of exports is based on the season average price received by US farmers. Data source: USDA.
In figure 3, it can be seen that the farmgate value of US corn exports (dashed blue line) is closely related to the price (solid red line). That means that export levels can stay the same or increase and the value of production can fall as long as the price falls faster than exports increase.
While the constant mantra since 1985 proclaims that lowering price benefits farmers by increasing the volume, corn farmers actually benefit not from a drop in price to some “world level” but from an increase in price during an era of relatively flat, but variable, exports.
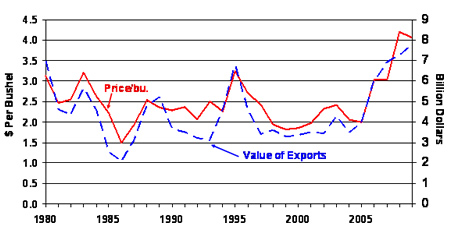
Figure 3. US corn, price and value of exports. Price and the value of exports are based on the season average price received by US farmers. Data source: USDA.
Over the past thirty years there has been little recognition that the world market for corn exports is relatively flat, with variations due to production fluctuations in the countries of our importing customers and export competitors.
Another important factor, though seldom discussed, is the increase in corn production over time in the countries that consume it. While US farmers have repeatedly been promised increases in corn exports to be used to produce meat for a growing middle class in other countries, many those countries have chosen to grow all or much of their own grain, resulting in a flat export market.
Like in the US, other countries do not want to become dependent upon imports to feed their people. They would prefer to import only when their production falls short of domestic needs. That may not be what farmers want to hear but neither should they want to hear only the parts of export stories that, in isolation, paint unrealistic pictures.
Daryll E. Ray holds the Blasingame Chair of Excellence in Agricultural Policy, Institute of Agriculture, University of Tennessee, and is the Director of UT’s Agricultural Policy Analysis Center (APAC). (865) 974-7407; Fax: (865) 974-7298; dray@utk.edu; http://www.agpolicy.org. Daryll Ray’s column is written with the research and assistance of Harwood D. Schaffer, Research Associate with APAC.
Reproduction Permission Granted with:
1) Full attribution to Daryll E. Ray and the Agricultural Policy Analysis Center, University of Tennessee, Knoxville, TN;
2) An email sent to hdschaffer@utk.edu indicating how often you intend on running Dr. Ray’s column and your total circulation. Also, please send one copy of the first issue with Dr. Ray’s column in it to Harwood Schaffer, Agricultural Policy Analysis Center, 309 Morgan Hall, Knoxville, TN 37996-4519.