
March 14, 2003
Soybeans versus soybean complex
Looking at what has happened to soybean exports since 1976 is more challenging than looking at exports for corn for the same period. Most of the time, and we are just as guilty of this as the rest, analysts look at the export of beans as a bulk commodity. When we do that we see domestic demand grow from an average of 1,095 million bushels during the 1976-1985 period to an average of 1,770 bushels in the 1996-2002 time frame (fig.1). Exports of raw beans grows, after a dip in the 1986-1995 period, from an average of 752 million bushels (1976-1985) to 911 million bushels (1996-2002).
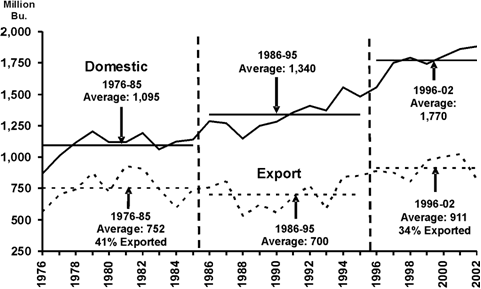
Figure 1. A comparison of U.S. bulk soybean domestic demand and exports, 1976-2002, by period. Source: USDA PS&D.
The problem with this usual view is that it does not take into account the fact that part of the domestic demand is crush and that part of the resulting soybean oil and soybean meal are exported. It also does not take into consideration the net amount of soybean complex (soybeans, soybean oil, and soybean meal) that is fed to animals and exported as meat. To have a true picture of what is happening to the soybean domestic and export markets we need to look at soybean complex, adjusting for the soybean complex portion of net meat exports. Because the three elements of soybean complex are measured using different units, we have chosen to convert all of them to million metric tons.
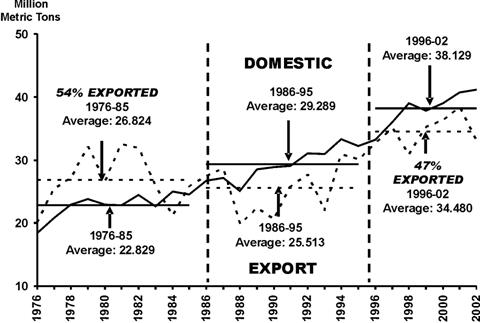
Figure 2. A comparison of U.S. soybean complex domestic demand and exports, 1976-2002, by period. Source: USDA PS&D.
When we look at soybean complex, adjusted for meat exports, the picture looks somewhat different. In the 1976-1985 period, the export of soybean complex (figure 2) accounted for the largest part (54 percent) of U.S. disappearance compared to 41 percent in figure 1. In the mid to late 1980s domestic demand for soybean complex began to exceed exports and has continued to account for the largest share of the U.S. soybean complex market. In the most recent period, the export of soybean complex (1996-2002) stood at 47 percent.
What has not changed in shifting from looking at bulk soybeans to soybean complex is the fact that domestic demand has grown faster over the last 26 years than soybean exports. The average domestic demand for soybean complex has grown by 67 percent from the 1976-1985 period to the 1996-2002 period. Export demand has grown by 28 percent over the same period. But since the 1990s, domestic demand and export demand have grown at roughly comparable rates, with exports showing more variation.
What will the future bring? With the proclivities of South America and China, I would rather predict the trend for domestic soybean complex demand than the future for exports.
Daryll E. Ray holds the Blasingame Chair of Excellence in Agricultural Policy, Institute of Agriculture, University of Tennessee, and is the Director of the UT's Agricultural Policy Analysis Center. (865) 974-7407; Fax: (865) 974-7298; dray@utk.edu; http://www.agpolicy.org.
Reproduction Permission Granted with:
1) Full attribution to Daryll E. Ray and the Agricultural Policy Analysis Center, University of Tennessee, Knoxville, TN;
2) An email sent to hdschaffer@utk.edu indicating how often you intend on running Dr. Ray's column and your total circulation. Also, please send one copy of the first issue with Dr. Ray's column in it to Harwood Schaffer, Agricultural Policy Analysis Center, 310 Morgan Hall, Knoxville, TN 37996-4500.