
Are you confused about WTO trade liberalization numbers?
Are you confused about the various numbers being bandied about that purport to quantify the 2015 gains to be had by World Trade Organization (WTO) trade liberalization? Are the gains for the world $832 billion, or $520 billion, or $287 billion, or $96 billion? How about the developing countries who are the focus and rationale for this round of trade negotiations? Will they gain $539 billion, or $350 billion, or $128 billion or a mere $32 billion?
We work with these numbers and the reports they come from on a regular basis and we still struggle to keep them all straight. If the stakes were not so high, we would be inclined to shrug off the differences in the results of the various models as inconsequential. But with this round of trade negotiations being driven by an attempt to help the least developed countries of the world, and with agriculture playing a big role in the discussions, we can ill afford to ignore these differences.
The often made argument is that the rich US and European farmers are going to have to give up their subsidies so that 140 million people can be lifted out of poverty. In the US, we see organizations bringing poor developing country farmers on tour as they argue against US subsidies. As a result, the stakes in understanding the various numbers have never been higher.
Let’s focus on two of the major reasons for this cascade of changing results. The first is a change in the database used to develop the trade models. The second is a matter of which scenario is publicized. Let us look at these one at a time, setting aside other methodological problems that we have discussed in earlier columns.
There has been a change in the GTAP (Global Trade Analysis Project) database that is being used in most major models. Sandra Polaski, in “Winners and Losers: Impact of the Doha Round on Developing Countries, writes, “The update of the GTAP database is a major factor explaining some large differences in results among different models that have been used to simulate outcomes of the Doha Round since negotiations were launched in 2001.”
The older databases are based on world conditions as of 1995 (GTAP 4) or 1997 (GTAP 5). “Models that use earlier versions of GTAP (GTAP 5 or earlier) overstate the gains that can be achieved from further trade liberalization in the Doha Round. . . . They count as potential Doha Round gains many changes that already were secured through the Uruguay Round or through accession of new WTO member countries. These changes include tariff reductions under the Uruguay Round, the end of the global apparel quota system, and the accession of China to the WTO,” Polaski explains.
Another lapse is the failure to recognize that some developing countries are the beneficiaries of previously negotiated trade preferences with specific countries or sets of countries. These already enjoyed preferences are counted as gains in the older models, thus inflating the benefits of trade liberalization. Frank Ackerman in “The Shrinking Gains from Trade: A Critical Assessment of Doha Round Projections” notes that some earlier forecasts “did not completely anticipate the rapid pace of recent reductions in trade barriers, the rapid growth of East Asian economies, and other economic changes that affect the models.” The consequence of these and other problems is that the earlier models overstate the gains that would result from trade liberalization.
In addition to including impacts that occurred prior to and independent of the Doha Round, a second major cause of differences, even in models using the same database, is the various scenarios being studied and publicized. Most models begin with a full trade liberalization scenario that includes the elimination of all trade distorting subsidies and all tariffs. The full trade liberalization scenarios, as would be expected, generate the greatest gains from trade negotiations. The problem with the projections based on these scenarios is that most analysts consider the chances for full trade liberalization to be slim to none.
To better cover the range of possibilities, modelers usually make a number of runs that assume varying degrees of trade liberalization. Not unexpectedly, the results are smaller than for full liberalization. Study authors usually then designate one scenario as the “likely result of the Doha Round.” The “most likely” and “full” liberalization scenarios are featured, often confusingly, in press releases and press conferences.
Table 1 summarizes the numbers we have talked about and where they fit in to our analysis.
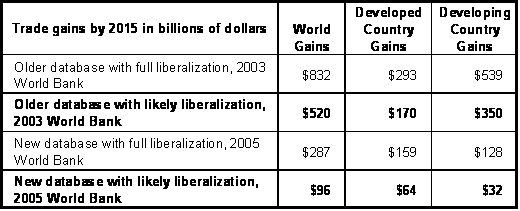
Table 1. 2015 trade gains projected by representative models using older and more recent databases and contrasting trade scenarios.
It is common for print and online stories to not clearly specify which study time-frame and scenarios are being referred to. Often this results in a contradiction between the numbers the writers are using and the policies that are being analyzed in the story. If one is going to refer to trade liberalization studies, it is misleading to quote numbers from an outdated study or from a study that assumes full liberalization. In terms of World Bank WTO studies, it is our opinion that the last line of the table is the best set of numbers to quote.
There are two extremely important caveats that need to be made when even these numbers are being reported. The first is that the “most likely” designations are probably now too optimistic. The second is that there are a host of methodological issues that may cause continued overestimation of trade liberalization benefits. These include the assumptions that (1) there is no voluntary unemployment and (2) governments are able to seamlessly transition from relying on tariffs to other sources of revenue.
Daryll E. Ray holds the Blasingame Chair of Excellence in Agricultural Policy, Institute of Agriculture, University of Tennessee, and is the Director of UT’s Agricultural Policy Analysis Center (APAC). (865) 974-7407; Fax: (865) 974-7298; dray@utk.edu; http://www.agpolicy.org. Daryll Ray’s column is written with the research and assistance of Harwood D. Schaffer, Research Associate with APAC.
Reproduction Permission Granted with:
1) Full attribution to Daryll E. Ray and the Agricultural Policy Analysis Center, University of Tennessee, Knoxville, TN;
2) An email sent to hdschaffer@utk.edu indicating how often you intend on running Dr. Ray’s column and your total circulation. Also, please send one copy of the first issue with Dr. Ray’s column in it to Harwood Schaffer, Agricultural Policy Analysis Center, 309 Morgan Hall, Knoxville, TN 37996-4519.