
World less dependent on US crop exports in 2009 than in 1980
In our last three columns we have looked at the production of corn, wheat, and soybeans and the exports of corn, wheat, and soybean complex. This column looks at the sum of the three crops to give a broader picture of agriculture and particularly of the crops that account for the utilization of the majority of the acres of US cropland.
Between 1980 and 2009, the world production of corn, wheat, and soybeans grew by 86 percent, increasing from 926 million metric tons to 1.73 billion metric tons (Fig. 1 solid red line). During that same period, the world population grew from 4.5 billion people to 6.8 billion, an increase of 51 percent. On average, the world production of the three crops grew at a rate 40 percent faster than population.
World exports of corn, wheat and soybean complex grew from 218 million metric tons to 362 million metric tons during the 30 year period beginning in 1980 (Fig. 1 dashed blue line), an increase of 66 percent as nations relied less and less on imports of these crops.
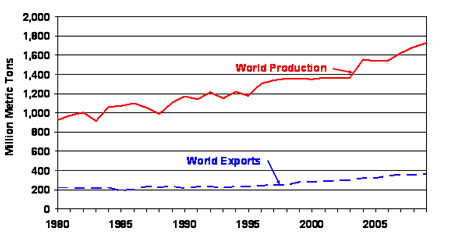
Figure 1. World Production of the total of corn, wheat and soybeans and exports of the total of corn, wheat, and soybean complex, 1980-2009. Data Source: USDA.
As a result, the percentage of the world production of corn, wheat, and soybeans that was exported as corn, wheat and soybean complex declined from 23.6 percent in 1980 to 20.9 percent in 2009 (Fig. 2). This occurred despite the significant increase in soybean exports to China that began in 1995. Without the Chinese imports of soybeans, the world export percentage would have dropped to 18.5 percent.
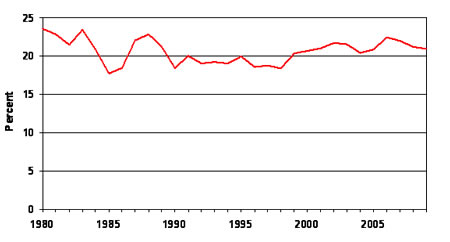
Figure 2. World exports of the total of corn, wheat and soybean complex as a percentage of world production of corn, wheat, and soybeans, 1980-2009. Data Source: USDA.
In the US, the production of corn, wheat and soybeans grew from 289 million metric tons in 1980 to 486 million tons in 2009 (Fig. 3 solid red line), an increase of 71 percent. This was a smaller rate of increase than the world’s 86 percent increase. Given the US’s higher yield levels in 1980 compared to many parts of the world and its relatively fixed base of cropland, this is not an unexpected result.
Despite a concerted effort to increase the exports of grains and oilseeds, the US exports of corn, wheat and soybean complex fell from 129 million metric tons to 122 million metric tons over the same 30 year period (Fig 3 dashed blue line). This 5 percent drop in exports occurred during a period in which world exports of these same products increased by 66 percent.
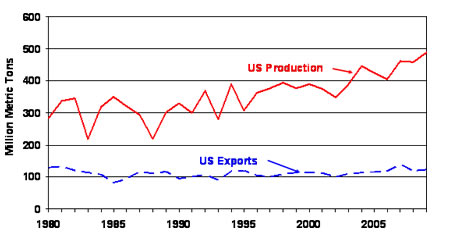
Figure 3. US Production of the total of corn, wheat and soybeans and exports of the total of corn, wheat, and soybean complex, 1980-2009. Data Source: USDA.
The share of the 1980 US corn, wheat, and soybean crop that was exported as corn, wheat, and soybean complex was 45.2 percent (Fig 4). The export share topped 50 percent twice (1983 and 1988). By 2009 the export share had dropped to 25 percent, representing a decline of 45 percent.
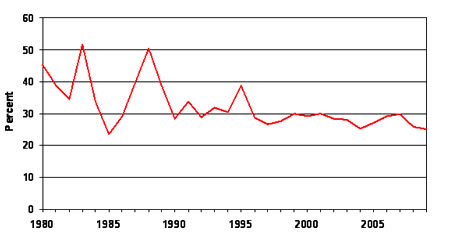
Figure 4. US exports of the total of corn, wheat and soybean complex as a percentage of US production of corn, wheat, and soybeans, 1980-2009. Data Source: USDA.
In the last two years, we have heard a lot about both the possibilities and the needs for increased exports of grains and oilseeds as a means of reducing world hunger. The numbers that we have just looked at suggest that the greatest potential for reducing world hunger may come from domestic production in the developing world, with developed world exports providing insurance during times of localized crop failures.
As for the oft sold and seldom delivered upon promise of an export driven prosperity for US farmers, the numbers provide little hope. Domestic production in the world grew at a faster rate than the world’s population despite comments to the contrary. As a result the world is less dependent upon US exports in 2009 than it was in 1980.
Next week we will look at these same three crops, examining the issue of the difference between growth in the value of exports and the volume of exports.
Daryll E. Ray holds the Blasingame Chair of Excellence in Agricultural Policy, Institute of Agriculture, University of Tennessee, and is the Director of UT’s Agricultural Policy Analysis Center (APAC). (865) 974-7407; Fax: (865) 974-7298; dray@utk.edu; http://www.agpolicy.org. Daryll Ray’s column is written with the research and assistance of Harwood D. Schaffer, Research Associate with APAC.
Reproduction Permission Granted with:
1) Full attribution to Daryll E. Ray and the Agricultural Policy Analysis Center, University of Tennessee, Knoxville, TN;
2) An email sent to hdschaffer@utk.edu indicating how often you intend on running Dr. Ray’s column and your total circulation. Also, please send one copy of the first issue with Dr. Ray’s column in it to Harwood Schaffer, Agricultural Policy Analysis Center, 309 Morgan Hall, Knoxville, TN 37996-4519.